Exploring Noise in Data
Robert Dunn, Amelia Kawasaki, Cheolmin Hwang
Why do we care about noise in our data?
Noise level of training data is key to the performance of a prediction model. We intend to find out how much noise impacts the performance of prediction models in order to demonstrate the effects of overfitting a model.
What is overfitting?
Overfitting is a concept in which a model is fit exactly to the data it was trained with resulting in poor performance on unseen examples of data. This is due to the fact that new examples of data will likely have slight variations that do not appear in the training set meaning that the model will not be able to detect such variations.
Significance between noise and overfitting
By fitting models with a given amount of noise, we can view how different models perform. Based on the understanding of overfitting a model, it would be expected that fitting noisy data exactly would significantly decrease the performance of such a model, however, as shown below, it can be observed that this is not necessarily the case in many different types of models to a certain extent.
Methodology
Used MNIST dataset.
Corrupted the datasets by randomizing a set proportion of their labels or the pixels of their images.
Tested training on multiple models: Gaussian/Laplacian kernel functions, K-Nearest Neighbor classifier, Random Forest Classifier, Neural Network.
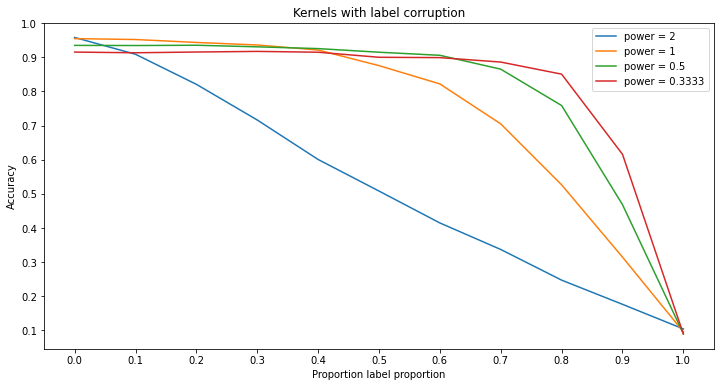
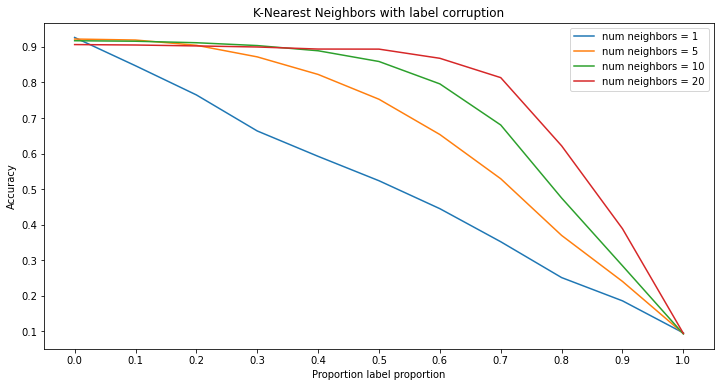
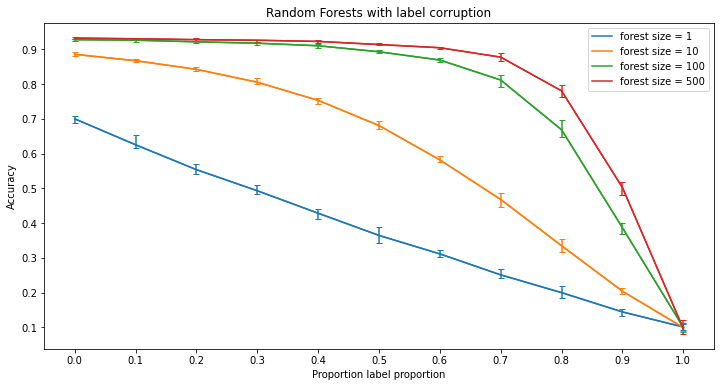
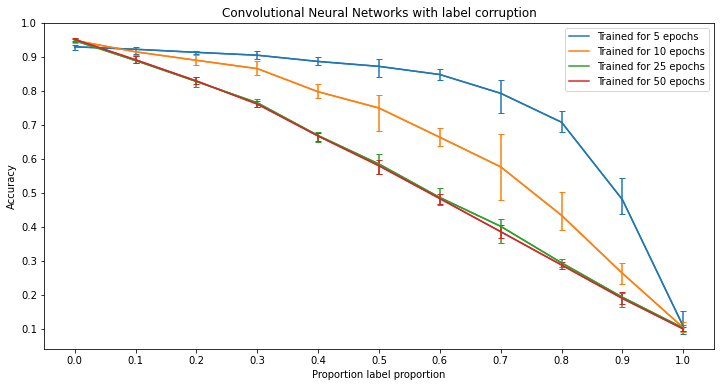
Results - Label Corruption
Significance of Results - Label Corruption
As seen, it is fairly easy for a model to be overfit by label corruption. However, certain models are able to resist such corruption. Something to note however is the difference between the results of the random forests and k-nearest neighbors versus the kernel machines and neural networks. Specifically, in the case of the random forests and k-nearest neighbor models, the models tend to keep a relatively high accuracy with the addition of corrupted labels when the model becomes more ‘deep.’ This means that by adding more trees or more neighbors to the respective model, the resulting model has a higher resistance to label corruption. On the other hand, kernel machines and neural networks both work in separate ways. For the case of neural networks, it can be seen that overtraining the network leads to better performance in completely clean data, whereas with any level of corruption, training the network for too long leads to a large decrease in accuracy as the model begins to overfit. Lastly, kernels work different entirely because changing the power of the kernel function only changes how the classifier is calculated rather than making the model more deep than the other three models.
Results - Random Corruption
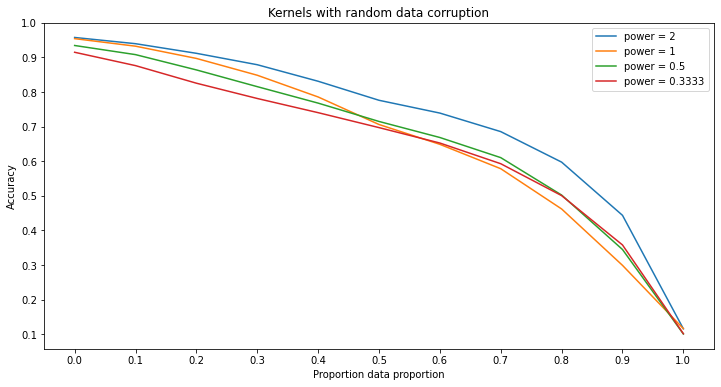
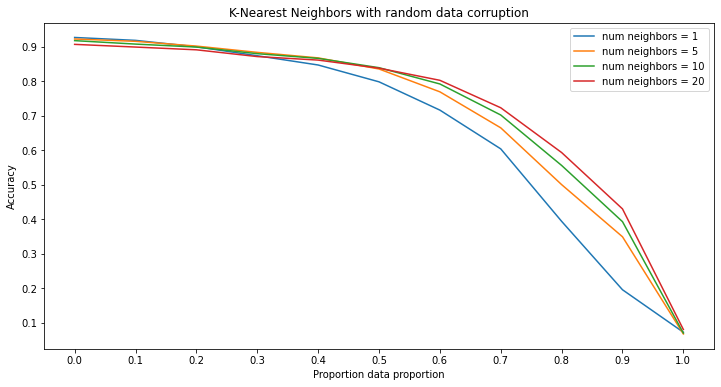
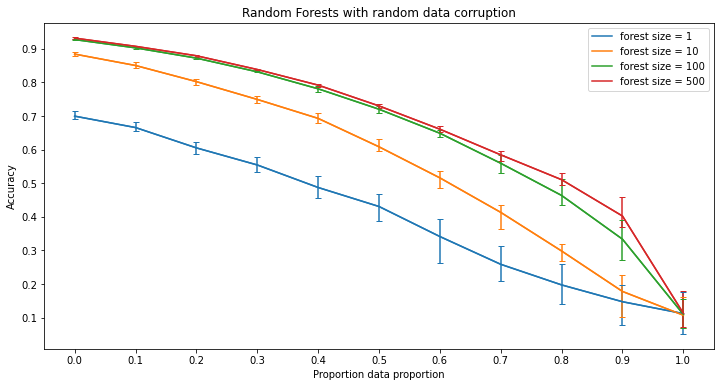
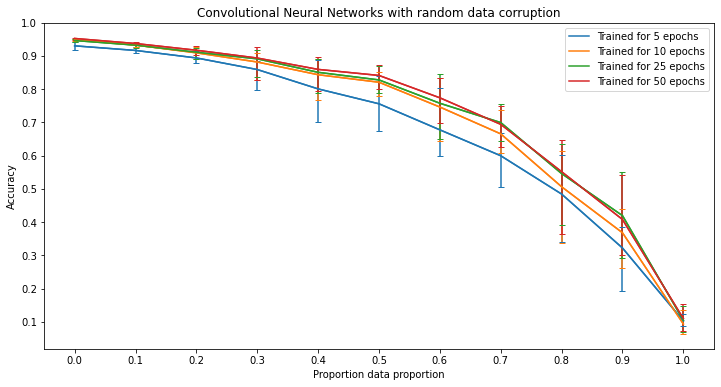
Significance of Results - Random Corruption
Unlike in label corruption, each model is fairly resistant to random corruption. Furthermore, each model is strictly improved by making them more deep in their respective ways, except for kernels machines due to the way those models are constructed. Something to note about the kernel machines however is that in the case of random corruption, kernel machines with a higher power kernel function tend to resist the corruption more whereas in label corruption, those with lower power kernel functions are more resistant to the corruption.
Side note about error bars
In the figures for random forests and neural networks, each line contains error bars while the figures for kernel machines and k-nearest neighbors do not. This is because of the way these models are trained. In the training process for random forests and neural networks, there is a given randomness while kernel machines and k-nearest neighbors do not assuming that the dataset is the same. This means that with a given dataset, training multiple random forests or neural networks with the same parameters will produce variation in the results whereas training multiple kernel machines or k-nearest neighbor classifiers will always produce the same results. Therefore, in order to capture this randomness the random forests and neural networks were run multiple times to show such variation. Then using the results, the lines for these models are the average of the accuracies of each instance run at that level of corruption and the error bars represent the minimum and maximum accuracy of all instances.